Pixl.js Spectrum Analyser
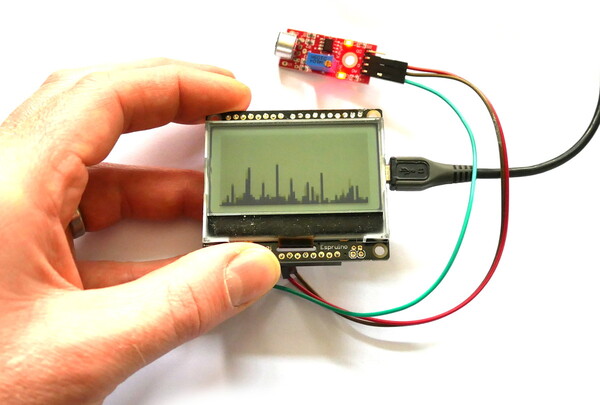
This example outputs a spectrum analyser on Pixl.js's LCD display.
Simply attach an amplified Microphone
or some other varying input to pin A0 on a Pixl.js board,
connect, and upload the code.
The FFT calculation is performed in double arithmetic and is slow, so this won't be a real-time FFT. For faster updates consider slowing down the sample rate and lowering the buffer size.
Note: Some microphone boards have a potentiometer to adjust DC offset. If so, try running the Oscilloscope Example and adjust the potentiometer until the waveform is in the middle of the screen.
Source Code
var w = new Waveform(128,{doubleBuffer:true});
var freq = new Uint8Array(128);
var SAMPLERATE = 1000; /* Hz */

w.on("buffer", function(buf) {
  // copy to another buffer
  freq.set(buf);
  // perform FFT
  E.FFT(freq);
  // plot the FFT (only the 'real' part)
  g.clear();
  for (var x=0;x<63;x++)
    g.fillRect(x*2,63-freq[x+1]*2,x*2+1,63);
  g.flip();
});

w.startInput(A0,SAMPLERATE,{repeat:true});
This page is auto-generated from GitHub. If you see any mistakes or have suggestions, please let us know.