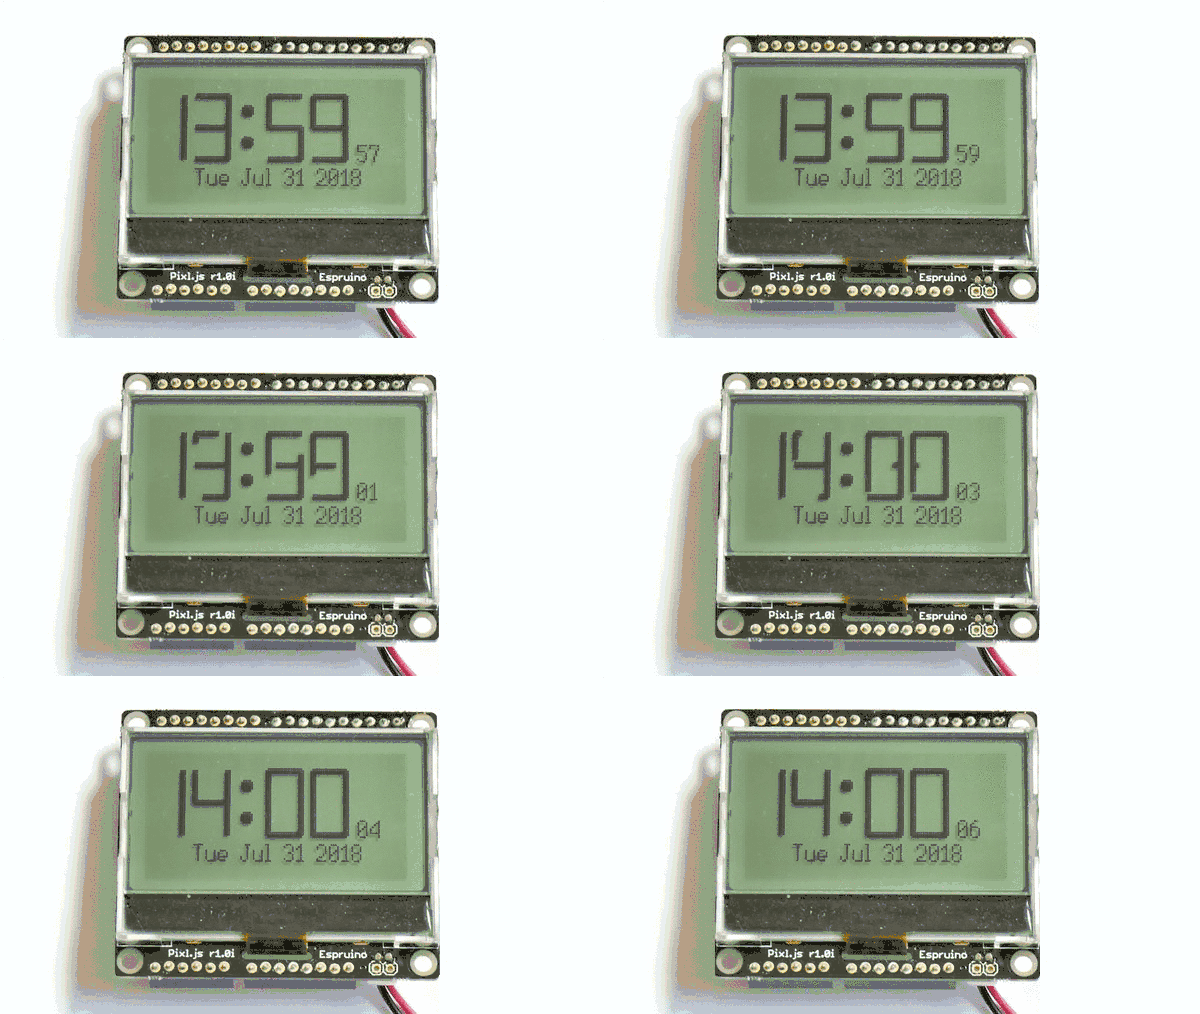
Morphing 7 Segment Clock

This example turns a Pixl.js into a 7 segment clock where the digits 'morph' smoothly into new digits as the time changes. It is based on the idea in this instructable
Copy this to the right-hand side of the IDE, make sure Set Current Time
is set in Settings -> Communications, and upload.
You can always update the time manually using the command
setTime(Date.parse("2018-05-16T13:42:34") / 1000), with
the correct date string.
This should work on a variety of different Espruino devices and screen types -
just ensure that you set up an instance of Graphics in a variable named g.
The getLines function returns an array of line segments using the coordinates
0,0 -> 1,2, so can be scaled for different resolutions of display.
Source Code
// Enable 'Set Current Time' in Settings -> Communications before sending

// The last time that we displayed
var lastTime = "00:00";
// If animating, this is the interval's id
var animInterval;

// Load a bigger font for seconds/time
require("Font8x12").add(Graphics);

/* Get array of lines from digit d to d+1.
 n is the amount (0..1)
 maxFive is true is this digit only counts 0..5 */
function getLines(d, n, maxFive) {
  var r = Math.PI*n/2;
  switch (d) {
    case "0": return [
      [n,0,1,0],
      [1,0,1,1],
      [1,1,1,2],
      [n,2,1,2],
      [n,1,n,2],
      [n,0,n,1]];
    case "1": return [
      [1-n,0,1,0],
      [1,0,1,1],
      [1-n,1,1,1],
      [1-n,1,1-n,2],
      [1-n,2,1,2]];
    case "2": return [
      [0,0,1,0],
      [1,0,1,1],
      [0,1,1,1],
      [0,1+n,0,2],
      [1,2-n,1,2],
      [0,2,1,2]];
    case "3": return [
      [0,0,1-n,0],
      [0,0,0,n],
      [1,0,1,1],
      [0,1,1,1],
      [1,1,1,2],
      [n,2,1,2]];
    case "4": return [
      [0,0,0,1],
      [1,0,1-n,0],
      [1,0,1,1-n],
      [0,1,1,1],
      [1,1,1,2],
      [1-n,2,1,2]];
    case "5": return maxFive ? [ // 5 -> 0
      [0,0,0,1],
      [0,0,1,0],
      [n,1,1,1],
      [1,1,1,2],
      [0,2,1,2],
      [0,2,0,2],
      [1,1-n,1,1],
      [0,1,0,1+n]] : [ // 5 -> 6
      [0,0,0,1],
      [0,0,1,0],
      [0,1,1,1],
      [1,1,1,2],
      [0,2,1,2],
      [0,2-n,0,2]];
    case "6": return [
      [0,0,0,1-n],
      [0,0,1,0],
      [n,1,1,1],
      [1,1-n,1,1],
      [1,1,1,2],
      [n,2,1,2],
      [0,1-n,0,2-2*n]];
    case "7": return [
      [0,0,0,n],
      [0,0,1,0],
      [1,0,1,1],
      [1-n,1,1,1],
      [1,1,1,2],
      [1-n,2,1,2],
      [1-n,1,1-n,2]];
    case "8": return [
      [0,0,0,1],
      [0,0,1,0],
      [1,0,1,1],
      [0,1,1,1],
      [1,1,1,2],
      [0,2,1,2],
      [0,1,0,2-n]];
    case "9": return [
      [0,0,0,1],
      [0,0,1,0],
      [1,0,1,1],
      [0,1,1-n,1],
      [0,1,0,1+n],
      [1,1,1,2],
      [0,2,1,2]];
    case ":": return [
      [0.4,0.4,0.6,0.4],
      [0.6,0.4,0.6,0.6],
      [0.6,0.6,0.4,0.6],
      [0.4,0.4,0.4,0.6],
      [0.4,1.4,0.6,1.4],
      [0.6,1.4,0.6,1.6],
      [0.6,1.6,0.4,1.6],
      [0.4,1.4,0.4,1.6]
      ];
  }
  return [];
}

/* Draw a transition between lastText and thisText.
 'n' is the amount - 0..1 */
function draw(lastText,thisText,n) {
  var x = 1;  // x offset
  var y = 10; // y offset
  var s = 16; // character size
  g.clear();
  for (var i=0;i<lastText.length;i++) {
    var lastCh = lastText[i];
    var thisCh = thisText[i];
    var ch, chn = n;
    if (lastCh!==undefined &&
        (thisCh-1==lastCh ||
         (thisCh==0 && lastCh==5) ||
         (thisCh==0 && lastCh==9)))
      ch = lastCh;
    else {
      ch = thisCh;
      chn = 0;
    }
    var l = getLines(ch,chn,lastCh==5 && thisCh==0);
    if (ch==":") x-=4;
    l.forEach(function (c) {
      if (c[0]!=c[2]) // horiz
        g.fillRect(x+c[0]*s,y+c[1]*s-1,x+c[2]*s,y+c[3]*s+1);
      else if (c[1]!=c[3]) // vert
        g.fillRect(x+c[0]*s-1,y+c[1]*s,x+c[2]*s+1,y+c[3]*s);
    });
    if (ch==":") x-=4;
    x+=22;
  }
  var d = new Date();
  g.setFont8x12();
  g.setFontAlign(-1,-1);
  g.drawString(("0"+d.getSeconds()).substr(-2), x, y+2*s-8);
  // date
  g.setFontAlign(0,-1);
  g.drawString(d.toString().substr(0,15), g.getWidth()/2, y+2*s+4);
  g.flip();
}

/* Show the current time, and animate if needed */
function showTime() {
  if (animInterval) return; // in animation - quit
  var d = new Date();
  var t = (" "+d.getHours()).substr(-2)+":"+
          ("0"+d.getMinutes()).substr(-2);
  var l = lastTime;
  // same - don't animate
  if (t==l) {
    draw(t,l,0);
    return;
  }
  var n = 0;
  animInterval = setInterval(function() {
    n += 1/16; /* 16px wide, so need 16(17) steps */
    if (n>=1) {
      n=1;
      clearInterval(animInterval);
      animInterval=0;
    }
    draw(l,t,n);
  }, 50);
  lastTime = t;
}

// Update time once a second
setInterval(showTime, 1000);
This page is auto-generated from GitHub. If you see any mistakes or have suggestions, please let us know.