WiFi Enabled Thermometer
Introduction
This is a simple WiFi enabled thermometer. We'll get temperature using the DS18B20 and we'll store a few samples worth of history.
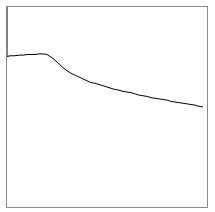
There will be a WebServer on the CC3000, and when it is queried, a webpage will be displayed that shows a line graph of the temperature over time.
You'll Need
- One Espruino Board
- A DS18B20 Temperature sensor and 4.7k resistor
- A CC3000 WiFi module
Wiring Up
- Follow the instructions for wiring up the CC3000 module
- Connect up the DS18B20 Temperature sensor as follows:
| Sensor Wire | Espruino | 4.7k Resistor |
|---|---|---|
| Black | GND | |
| Red | 3.3v | 1st wire |
| White | A1 | 2nd wire |
Software
Connect to the Espruino, copy and paste this into the right-hand side of the Web IDE (replacing the Access point name and password with your WiFi Access Point's name and password), and then click the Send to Espruino button.
var ow = new OneWire(A1);
var sensor = require("DS18B20").connect(ow);
var history = new Float32Array(30);

setInterval(function() {
  var temp = sensor.getTemp();
  console.log(temp);
  // move history back
  for (var i=1;i<history.length;i++)
    history[i-1]=history[i];
  // insert new history at end
  history[history.length-1] = temp;
}, 2000);


function onPageRequest(req, res) {
  res.writeHead(200, {'Content-Type': 'text/html'});
  res.write('<html><head><meta http-equiv="refresh" content="5"></head>'+
            '<body><canvas id="canvas" width="200" height="200" style="border:1px solid #888;"></canvas><script>');
  res.write('var d='+JSON.stringify(history)+';'+
'var c=document.getElementById("canvas").getContext("2d");'+
'c.moveTo(0,100 - (d[0]-d[d.length-1])*10);'+
'for (i in d) c.lineTo(i*200/(d.length-1),100 - (d[i]-d[d.length-1])*10);'+
'c.stroke()'+
'</script>');
  res.end('</body></html>');
}


var wlan;
function onInit() {
  wlan = require("CC3000").connect();
  wlan.connect( "AccessPointName", "WPA2key", function (s) {
    if (s=="dhcp") {
      require("http").createServer(onPageRequest).listen(80);
      console.log("Server created at "+wlan.getIP().ip);
    }
  });
}

onInit();
And now you're done. The CC3000 takes a while to initialise so you may have to wait a minute or two. The code will print out the temperature every two seconds, and when connected it'll print its IP address. You can then connect to that with a web browser, which will draw a line graph of the last 30 temperature readings (refreshing every 5 seconds).
This page is auto-generated from GitHub. If you see any mistakes or have suggestions, please let us know.