Freezer Alarm
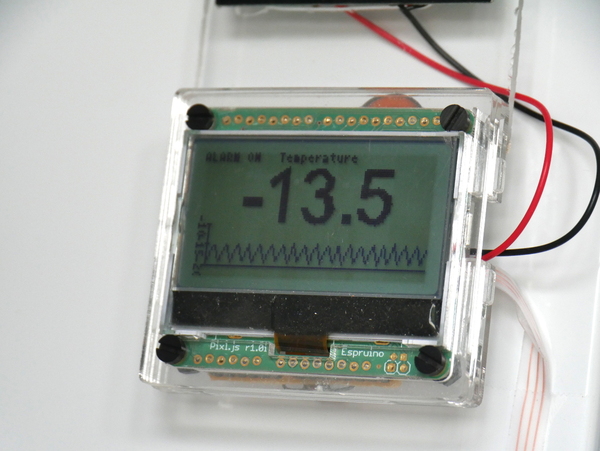
We've got a problem where every so often the freezer door doesn't close properly, and everything inside gets thawed out. While some freezers have an alarm built in, ours doesn't - so this tutorial shows you how to make one using Pixl.js. It beeps when the freezer gets too warm, but also shows the current and historical temperature and sends the data over Bluetooth LE so it can be logged.
You'll Need
- An Espruino Pixl.js
- A DS18B20 Temperature sensor - either a cable, or a small TO-92 sensor and some thin cable.
- A 4.7k resistor
- A LiPo Battery (or anything over 3.5v but below 15v)
- A Piezo Buzzer - I used this one from Rapid
Temperature Sensor
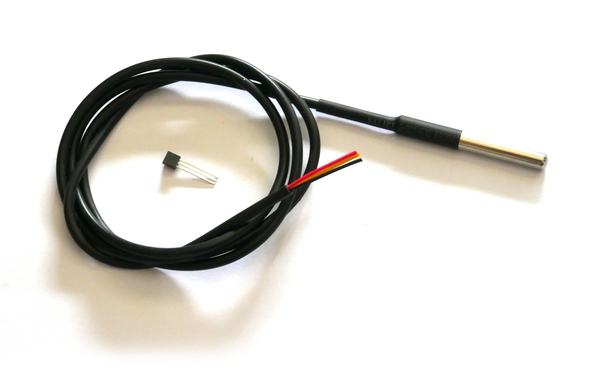
I'm using the DS18B20 because it's accurate, and digital - so there are no inaccuracies caused by having a long wire.
The sensors come in a few forms - you can get them with a cable attached (as above) or in a TO-92 package (in the middle of the above picture). While the cable is easy, you may find it difficult to fit into your freezer so the door shuts unless you're willing to drill a hole in it.
To work around this, I used the small transistor-style TO-92 type of DS18B20 with a thin cable that I added. It's wired as follows:
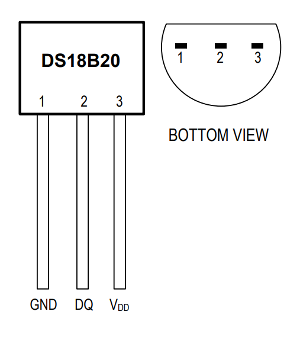
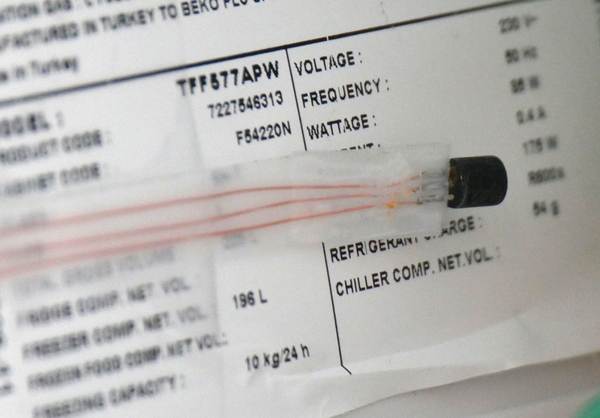
While you could buy a thin ribbon cable, I made one by placing 3 thin wires between two lengths of sellotape. It can then be fitted to your freezer along the side of the door and it won't interfere with the door closing:
Wiring Up
Wiring up is pretty simple:
- Connect the DS18B20 Temperature sensor
up to
3.3vandGNDas described in the link, with the data wire connected toA0. - Connect a 4.7k resistor between
A0and3.3v - Connect the Piezo Buzzer between pins
D10andGND. You could use any data pin, but with this piezo has a pin spacing of 10mm which allows you to just push it into Pixl.js's headers. - Connect a battery between
VinandGND. You can use the JST pinout or the Arduino header for this (or could just power from Micro USB). I also attached a small solar panel direct to the battery to keep it charged.
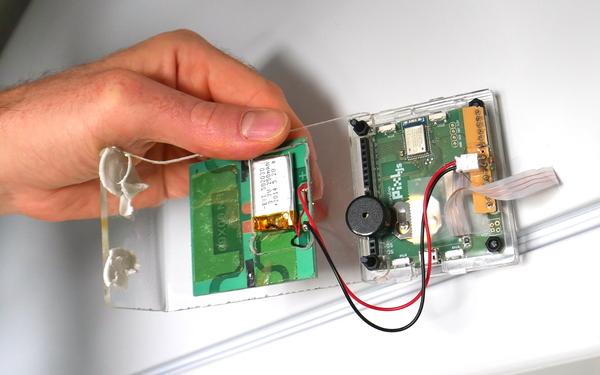
To simplify wiring, I used a small strip of PCB and with some pins in it to plug into the back of the Pixl, then taped the ribbon cable down to stop the wires from twisting and breaking. However it's fine to just poke wires into the pin headers to make connections if that's easier:
Software
Connect to Pixl.js with the Web IDE, copy the following code to the right-hand side and click upload.
var ALARM_TEMP = -5; // temperature at which to alarm
var PIN_BUZZER = D10; // Pin Buzzer is connected to
var PIN_SENSOR = A0;  // Pin temperature sensor is connected to

var ow,sensor,history;
var avrSum=0,avrNum=0;
var lastTemp = 0;

var alarmEnabled = true;
var alarmPos = 0;
var alarmInterval;

// Set whether the alarm is on or off
function setAlarm(on) {
  if (on) {
    if (!alarmInterval)
      alarmInterval = setInterval(function() {
        alarmPos = !alarmPos;
        analogWrite(PIN_BUZZER,0.5,{freq:alarmPos?800:900});
      }, 200);
  } else {
    if (alarmInterval)
      clearInterval(alarmInterval);
    alarmInterval = 0;
    digitalWrite(PIN_BUZZER,0);
  }
}

// Draw the temperature and graph to the screem
function draw() {
  // draw
  g.clear();
  g.setFontVector(30);
  g.setFontAlign(0,-1);
  g.drawString(lastTemp.toFixed(1), 64,5);
  g.setFontBitmap();
  g.drawString("Temperature", 64, 0);
  require("graph").drawLine(g, history, {
    axes : true,
    gridy : 5,
    x:0, y:37,
    width:128,
    height:27
  });
  g.setFontAlign(-1,-1);
  g.drawString(alarmEnabled?"ALARM ON":"NO ALARM",0,0);
  g.flip();
  // Check temperature
  setAlarm(alarmEnabled && (lastTemp>ALARM_TEMP));
}

// Called when we get a temperature reading
function onTemp(temp) {
  if (temp===null) return; // bad reading
  avrSum+=temp;
  avrNum++;
  lastTemp = temp;
  // advertising
  var th = Math.round(lastTemp*100);
  NRF.setAdvertising({
    0x1809 : [th&255,th>>8]
  });

  draw();
}

// BTN1 enables/disables the alarm
setWatch(function() {
  alarmEnabled = !alarmEnabled;
  draw();
}, BTN1, {edge:1,repeat:1});

// take temp reading and update graph/alarm
var readingInterval = setInterval(function() {
  if (sensor) sensor.getTemp(onTemp);
}, 10000);

// save average to history
var histInterval = setInterval(function() {
  history.set(new Float32Array(history.buffer,4));
  history[history.length-1] = avrSum / avrNum;
  avrSum = 0;
  avrNum = 0;
}, 60000); // 1 minute

// At startup, set up OneWire
function onInit() {
  ow = new OneWire(PIN_SENSOR);
  sensor = require("DS18B20").connect(ow);
  history = new Float32Array(128);
  avrSum=0;
  avrNum=0;
}
Once uploaded, type save() - this will save everything to Flash memory
and will start the code running.
Notes
BTN1will turn the audible alarm on and off (the state is shown on the screen).- The DS18B20 sensor itself draws around 1mA of power - around 4 times the amount Pixl.js does! While I haven't done so, you could wire the sensor to be powered from an IO pin so it can be turned off when not needed.
Logging
Since this code broadcasts the temperature via Bluetooth LE on the standard
characteristic 1809, you can install the EspruinoHub Software
on a Raspberry Pi with Bluetooth LE. When a log directory is created, it
will keep a log of the temperature in that directory.
You can then use the TinyDash library to plot those temperatures, for example:
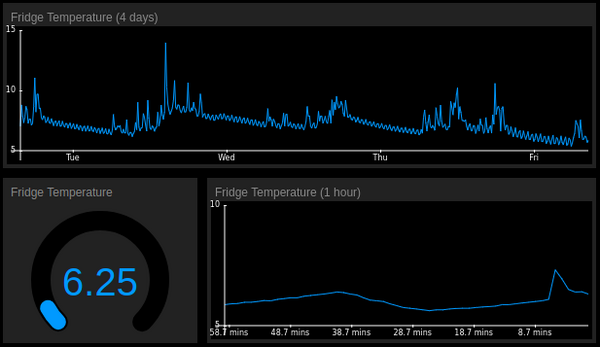
Details of this will follow in another tutorial.
This page is auto-generated from GitHub. If you see any mistakes or have suggestions, please let us know.