Bangle.js Data Streaming
This tutorial will show you how to stream data from Bangle.js to the PC. We're
going to use the accelerometer, along with Web Bluetooth on
the PC (using the puck.js library).
For more detailed info, check out this page on Web Bluetooth with Espruino.
First off you need to be able to either host a webpage on your own PC (HTTP via localhost)
or online via HTTPS. There's some info on doing this on the Web Bluetooth page.
Then copy this code and try it in a web browser.
Note: You can try it right now just by clicking Try Me in the bottom
right of the code snippet.
<html>
<head>
<title>Bangle.js Accelerometer streaming</title>
</head>
<body>
<script src="https://www.puck-js.com/puck.js"></script>
<button id="btnConnect">Connect</button>
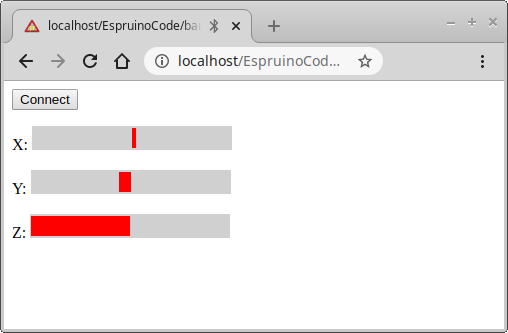
<p>X: <span class="bar"><span id="barX"></span></span></p>
<p>Y: <span class="bar"><span id="barY"></span></span></p>
<p>Z: <span class="bar"><span id="barZ"></span></span></p>
<script>
// Code to upload to Bangle.js
var BANGLE_CODE = `
Bangle.on('accel',function(a) {
var d = [
"A",
Math.round(a.x*100),
Math.round(a.y*100),
Math.round(a.z*100)
];
Bluetooth.println(d.join(","));
})
`;
// When we click the connect button...
var connection;
document.getElementById("btnConnect").addEventListener("click", function() {
// disconnect if connected already
if (connection) {
connection.close();
connection = undefined;
}
// Connect
Puck.connect(function(c) {
if (!c) {
alert("Couldn't connect!");
return;
}
connection = c;
// Handle the data we get back, and call 'onLine'
// whenever we get a line
var buf = "";
connection.on("data", function(d) {
buf += d;
var l = buf.split("\n");
buf = l.pop();
l.forEach(onLine);
});
// First, reset the Bangle
connection.write("reset();\n", function() {
// Wait for it to reset itself
setTimeout(function() {
// Now upload our code to it
connection.write("\x03\x10if(1){"+BANGLE_CODE+"}\n",
function() { console.log("Ready..."); });
}, 1500);
});
});
});
// When we get a line of data, check it and if it's
// from the accelerometer, update it
function onLine(line) {
console.log("RECEIVED:"+line);
var d = line.split(",");
if (d.length==4 && d[0]=="A") {
// we have an accelerometer reading
var accel = {
x : parseInt(d[1]),
y : parseInt(d[2]),
z : parseInt(d[3]),
};
// Update bar positions
setBarPos("barX", accel.x);
setBarPos("barY", accel.y);
setBarPos("barZ", accel.z);
}
}
// Set the position of each bar
function setBarPos(id,d) {
var s = document.getElementById(id).style;
if (d>150) d=150;
if (d<-150) d=-150;
if (d>=0) {
s.left="150px";
s.width=d+"px";
} else { // less than 0
s.left=(150+d)+"px";
s.width=(-d)+"px";
}
}
</script>
<style>
/* Styles just to make the bars for X Y and Z look neat */
.bar {
width : 500px;
height: 24px;
background-color : #D0D0D0;
position:relative;
display: inline-block;
}
.bar span {
width : 1px;
height: 20px;
background-color : red;
position:absolute;
display: inline-block;
left: 150px;
top: 2px;
}
</style>
</body>
</html>
Click Connect, choose your Bangle.js, and you should
instantly see the accelerometer readings in the browser.
So how does it work?
- When you click
Connect,Puck.connectcreates a connection to the Bangle using Web Bluetooth - The Bangle is reset and the contents of
BANGLE_CODEis uploaded - this takes accelerometer data and writes it to the web browser in the formA,x,y,z onLineis called for each new line, and it detects lines of the formA,x,y,zand updates the bars accordingly
You can easily add other Bluetooth.println to your code on Bangle.js
and then detect them in onLine.
Gotchas
The Web Bluetooth connection can only transfer around 2500 bytes per second. As a result you need to be careful you don't try and send more than that. Accelerometer data is 12.5Hz by default, and we round it to whole numbers to avoid sending too many characters.
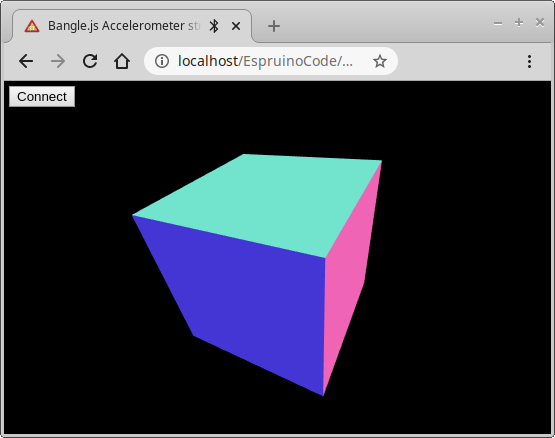
Bonus: 3D Rendering
3D looks much more exciting. This is identical code, just with the bottom part with the bars replaced with three.js WebGL rendering a cube.
<html>
 <head>
   <title>Bangle.js Accelerometer streaming in 3D</title>
 </head>
 <body style="margin:0px">
<script src="https://www.puck-js.com/puck.js"></script>
<button id="btnConnect" style="position:absolute;left:5px;top:5px;z-index:1000">Connect</button>
<script src="https://cdnjs.cloudflare.com/ajax/libs/three.js/r99/three.min.js"></script>
<script>
// Code to upload to Bangle.js
var BANGLE_CODE = `
Bangle.on('accel',function(a) {
  var d = [
    "A",
    Math.round(a.x*100),
    Math.round(a.y*100),
    Math.round(a.z*100)
    ];
  Bluetooth.println(d.join(","));
})
`;
var accel = new THREE.Vector3( 0, 0, 1 );

// When we click the connect button...
var connection;
document.getElementById("btnConnect").addEventListener("click", function() {
  // disconnect if connected already
  if (connection) {
    connection.close();
    connection = undefined;
  }
  // Connect
  Puck.connect(function(c) {
    if (!c) {
      alert("Couldn't connect!");
      return;
    }
    connection = c;
    // Handle the data we get back, and call 'onLine'
    // whenever we get a line
    var buf = "";
    connection.on("data", function(d) {
      buf += d;
      var l = buf.split("\n");
      buf = l.pop();
      l.forEach(onLine);
    });
    // First, reset the Bangle
    connection.write("reset();\n", function() {
      // Wait for it to reset itself
      setTimeout(function() {
        // Now upload our code to it
        connection.write("\x03\x10if(1){"+BANGLE_CODE+"}\n",
          function() { console.log("Ready..."); });
      }, 1500);
    });
  });
});

// When we get a line of data, check it and if it's
// from the accelerometer, update it
function onLine(line) {
  console.log("RECEIVED:"+line);
  var d = line.split(",");
  if (d.length==4 && d[0]=="A") {
    // we have an accelerometer reading
    accel.x = parseInt(d[1])/100;
    accel.y = parseInt(d[2])/100;
    accel.z = parseInt(d[3])/100;
    render();
  }
}
// WebGL boilerplate
var scene, camera, renderer, cube;
var WIDTH  = window.innerWidth;
var HEIGHT = window.innerHeight;
function init() {
    scene = new THREE.Scene();

    camera = new THREE.PerspectiveCamera(70, WIDTH / HEIGHT, 1, 10);
    camera.position.set(0, 3.5, 5);
    camera.lookAt(scene.position);

    cube = new THREE.Mesh(new THREE.CubeGeometry(2, 2, 2), new THREE.MeshNormalMaterial());
    scene.add(cube);

    renderer = new THREE.WebGLRenderer({ antialias: true });
    renderer.setSize(WIDTH, HEIGHT);

    document.body.appendChild(renderer.domElement);
}
function render() {
    cube.lookAt(accel);
    renderer.render(scene, camera);
}

init();
render();
</script>
 </body>
</html>
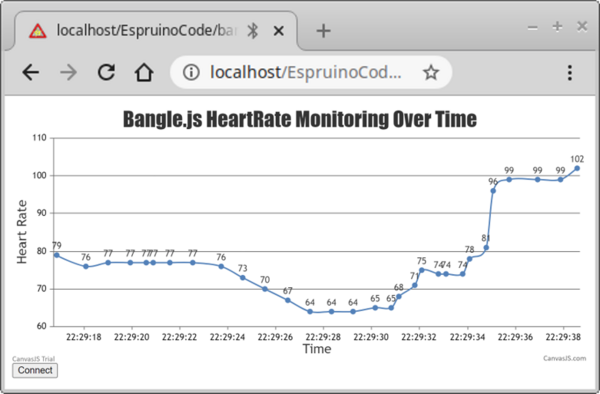
Bonus 2: Heart Rate Monitoring Graph
Here's another example showing the heartrate sensor data over time. The code is similar to the other examples. The big difference here is the code uploaded to the bangle and the bottom part where the graph is rendered as a canvas.js chart.
</html>
<head>
  <title>Bangle.js Heartrate streaming graph</title>
</head>
<body>
  <script src="https://canvasjs.com/assets/script/canvasjs.min.js"></script>
  <script src="https://www.puck-js.com/puck.js"></script>
  <div id="chartContainer" style="height: 370px; width:100%;"></div>
  <button id="btnConnect">Connect</button>
</body>
</html>
<script>
  // Code to upload to Bangle.js
  var BANGLE_CODE = `
  Bangle.setHRMPower(1)
  Bangle.on('HRM',function(hrm) {
    var d = [
      "H",
      hrm.bpm,
      hrm.confidence
      ];
    Bluetooth.println(d.join(","));
  })
  `;

  // When we click the connect button...
  var connection;
  document.getElementById("btnConnect").addEventListener("click", function() {
    // disconnect if connected already
    if (connection) {
      connection.close();
      connection = undefined;
    }
    // Connect
    Puck.connect(function(c) {
      if (!c) {
        alert("Couldn't connect!");
        return;
      }
      connection = c;
      // Handle the data we get back, and call 'onLine'
      // whenever we get a line
      var buf = "";
      connection.on("data", function(d) {
        buf += d;
        var l = buf.split("\n");
        buf = l.pop();
        l.forEach(onLine);
      });
      // First, reset the Bangle
      connection.write("reset();\n", function() {
        // Wait for it to reset itself
        setTimeout(function() {
          // Now upload our code to it
          connection.write("\x03\x10if(1){"+BANGLE_CODE+"}\n",
            function() { console.log("Ready..."); });
        }, 1500);
      });
    });
  });

  //Chart Setup
  var dps = []; // dataPoints
  var chart = new CanvasJS.Chart("chartContainer", {
    title :{
      text: "Bangle.js HeartRate Monitoring Over Time"
    },
    axisY:{
      title: "Heart Rate",
    },
    axisX:{
      title: "Time",
      valueFormatString: "HH:mm:ss",
    },
    data: [{
      type: "spline",
      indexLabel: "{y}",
      dataPoints: dps
    }]
  });

  chart.render();
  var dataLength = 30; // number of dataPoints visible at any point

  var updateChart = function (hr) {
    if (dps.length <= dataLength) {
      labelVal = new Date().toISOString();
      xVal = new Date;
      yVal = hr;
      dps.push({
        x: xVal,
        y: yVal
      });
    }

    if (dps.length > dataLength) {
      dps.shift();
    }

    chart.render();
  };

  // When we get a line of data, check it and if it's
  // from the heart rate monitor, update it
  function onLine(line) {
    console.log("RECEIVED:"+line);
    var d = line.split(",");
    if (d.length==3 && d[0]=="H") {
      // we have an HR monitor reading
      var hr_data = {
        hr : parseInt(d[1]),
        conf : parseInt(d[2]),
      };
      updateChart(hr_data.hr);
    }
  }

</script>
</html>
This page is auto-generated from GitHub. If you see any mistakes or have suggestions, please let us know.