Web Bluetooth Dashboards
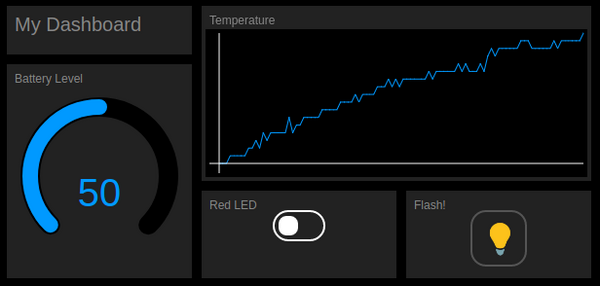
Sometimes you'll want to be able to make a webpage with buttons, graphs and gauges where you can quickly monitor or control your embedded devices. This tutorial will show you how to make something like the page below:
First, please check out the Web Bluetooth tutorial, as it'll show you how to develop Web Bluetooth pages.
We're going to use TinyDash, a very simple HTML dashboard library that only needs a few files.
Use the instructions in the the Web Bluetooth tutorial to set up your own HTTPS webpage, then put the following in it:
<html>
 <head>
  <title>Dashboard</title>
  <meta name="viewport" content="width=620, initial-scale=1">
 </head>
 <body style="width:620px;height:450px">
  <link href="https://espruino.github.io/TinyDash/tinydash.css" rel="stylesheet">
  <script src="https://espruino.github.io/TinyDash/tinydash.js"></script>
  <script src="https://www.puck-js.com/puck.js"></script>
  <script>
  var elements = {
    heading : TD.label({x:10,y:10,width:190,height:50,label:"My Dashboard"})
  }
  for (var i in elements)
    document.body.appendChild(elements[i]);
  </script>
 </body>
</html>
This is the bare miniumum you'll need for a dashboard, so what does it all do?
- The
<meta>tag makes sure the page renders at a 640 pixel width on devices like phones and tablets. You can adjust this once you've figured out how wide you want your dashboard. - The single-line
<link>and<script>tags bring in what we need for our dashboards and controlling Puck.js - The bigger
<script>tag contains the code for our Dashboard elements. We'll stick all our elements inelementsso we have an easy way to reference them - but you don't have to do this. TD.labelcreates a label component, and x, y, width and height are in pixels. For more types of component you can have in the dashboard, take a look in tinydash.js
Non-realtime Dashboard
To start off with, we'll create a dashboard that shows historical data from a Puck.js when you connect to it.
First, we're going to want some data to display. Upload this to Puck.js via the Web IDE:
// our historical data
var history = new Int16Array(100);

// Get Data and store it in RAM
function logData() {
  var data = E.getTemperature();
  for (var i=0;i<history.length-1;i++)
    history[i] = history[i+1];
  history[history.length-1] = data*100;
}

// Start recording
setInterval(logData, 1000);
It'll log a new temperature value to the history variable every second.
Now, disconnect and update the Web Bluetooth page with what's below
(or you can click Try Me! on the code snippet below).
<html>
 <head>
  <title>Dashboard</title>
  <meta name="viewport" content="width=620, initial-scale=1">
 </head>
 <body style="width:620px;height:450px">
  <link href="https://espruino.github.io/TinyDash/tinydash.css" rel="stylesheet">
  <script src="https://espruino.github.io/TinyDash/tinydash.js"></script>
  <script src="https://www.puck-js.com/puck.js"></script>
  <script>
  function connectDevice() {
    // connect, and ask for the battery percentage
    Puck.eval("{bat:E.getBattery()}", function(d,err) {
      if (!d) {
        alert("Web Bluetooth connection failed!\n"+(err||""));
        return;
      }
      // remove the 'connect' window
      elements.modal.remove();
      // update the controls with the values we received
      elements.bat.setValue(d.bat);
      // now get the history - these could take a while
      // so we do it separately.
      Puck.eval("history", function(d) {
        elements.temp.setData(d);
      });
    });
  }
  // Set up the controls we see on the screen
  var elements = {
    heading : TD.label({x:10,y:10,width:190,height:50,label:"My Dashboard"}),
    bat : TD.gauge({x:10,y:70,width:190,height:220,label:"Battery Level",value:0,min:0,max:100}),
    temp : TD.graph({x:210,y:10,width:400,height:180,label:"Temperature"}),
    redled : TD.toggle({x:210,y:200,width:200,height:90,label:"Red LED",value:0,onchange:function(el,v) {
      Puck.write("LED1.write("+v+");\n");
    }}),
    flash : TD.button({x:420,y:200,width:190,height:90,label:"Flash!",onchange:function(){
      Puck.write("digitalPulse(LED3,1,500);\n");
    }}),
    modal: TD.modal({x:10,y:10,width:600,height:430,label:"Click to connect",onchange:connectDevice})
  }
  for (var i in elements)
    document.body.appendChild(elements[i]);
  </script>
 </body>
</html>
So how does this work?
- First, we define all the dashboard components we want in
elements. - At the end, we add
TD.modal. This covers all the components and when clicked, callsconnectDeviceto initiate the Web Bluetooth connection (for security a connection can't be made automatically in Web Bluetooth). - After a connection is made, we use
Puck.evalto request the battery percentage, and then in a different request we get the entire contents of thehistoryarray. - Finally, clicking on the
Red LEDorFlashcomponents triggers theonchangecallback, which callsPuck.writeto perform the relevant action.
Realtime Dashboard
To get realtime updates from Puck.js we could repeatedly call Puck.eval to
get the information we want, but that'll be quite slow.
Instead, we'll use the two-way communications example from the Web Bluetooth tutorial.
For that, we use Puck.connect to create a two-way connection, use setInterval
on Puck.js to send data at regular intervals, and then pick it up in the
onLine handler function.
For the example we'll use the same Puck.light function to get realtime
light data, but have extended the Web Bluetooth example to output JSON
so more information can be transferred at once if needed.
<html>
 <head>
  <title>Dashboard</title>
  <meta name="viewport" content="width=210, initial-scale=1">
 </head>
 <body style="width:210px;height:450px">
  <link href="https://espruino.github.io/TinyDash/tinydash.css" rel="stylesheet">
  <script src="https://espruino.github.io/TinyDash/tinydash.js"></script>
  <script src="https://www.puck-js.com/puck.js"></script>
  <script>
  // Called when we get a line of data - updates the light color
  function onLine(line) {
    try {
      var j = JSON.parse(line);
      console.log("Received JSON: ",j);
      elements.light.setValue(j.light*100);
    } catch(e) {
      console.log("Received: ",line);
    }
  }
  var connection;
  function connectDevice() {
    Puck.connect(function(c) {
      if (!c) {
        alert("Couldn't connect!");
        return;
      }
      connection = c;
      // remove modal window
      elements.modal.remove();
      // Handle the data we get back, and call 'onLine'
      // whenever we get a line
      var buf = "";
      connection.on("data", function(d) {
        buf += d;
        var i = buf.indexOf("\n");
        while (i>=0) {
          onLine(buf.substr(0,i));
          buf = buf.substr(i+1);
          i = buf.indexOf("\n");
        }
      });
      // First, reset Puck.js
      connection.write("reset();\n", function() {
        // Wait for it to reset itself
        setTimeout(function() {
          // Now tell it to write data on the current light level to Bluetooth
          // 10 times a second. Also ensure that when disconnected, Puck.js
          // resets so the setInterval doesn't keep draining battery.
          connection.write("setInterval(function(){Bluetooth.println(JSON.stringify({light:Puck.light()}));},100);NRF.on('disconnect', function() {reset()});\n",
            function() { console.log("Ready..."); });
          }, 1500);
        });
      });

  }
  // Set up the controls we see on the screen
  var elements = {
    heading : TD.label({x:10,y:10,width:190,height:50,label:"My Dashboard"}),
    light : TD.gauge({x:10,y:70,width:190,height:220,label:"Light",value:0,min:0,max:100}),
    modal: TD.modal({x:10,y:10,width:190,height:430,label:"Click to connect",onchange:connectDevice})
  }
  for (var i in elements)
    document.body.appendChild(elements[i]);
  </script>
 </body>
</html>
Again you can click Try Me to try this out - you don't need to pre-load any
information onto your Puck for this.
This page is auto-generated from GitHub. If you see any mistakes or have suggestions, please let us know.