Simple Data Logger
This example shows you how to log Espruino's temperature over time and use it to create a graph.
Wiring
Connect a Battery to the JST battery connector. It doesn't have to be a big battery as Espruino won't use much power.
You can always power Espruino using a USB phone charger if you want to.
Usage
Just load the code below into Espruino using the Web IDE, then save it with the save() command and unplug Espruino from your computer.
Every 4 minutes (240 seconds) the Espruino Board will take a reading from the onboard temperature sensor and will save it. You can easily modify the code to change the time period.
A day later, take your Espruino board, plug it into your computer and connect to it with the Web IDE. Because 'deep sleep' has been enabled you may have to wait up to 4 minutes until the board next 'wakes up' before it will connect to USB.
In the left-hand side of the Web IDE type output(). This will call the output function which will output your data, one item per line, separated by tabs.
Now highlight all the data that was output. When you release the mouse button it will be copied to the clipboard.
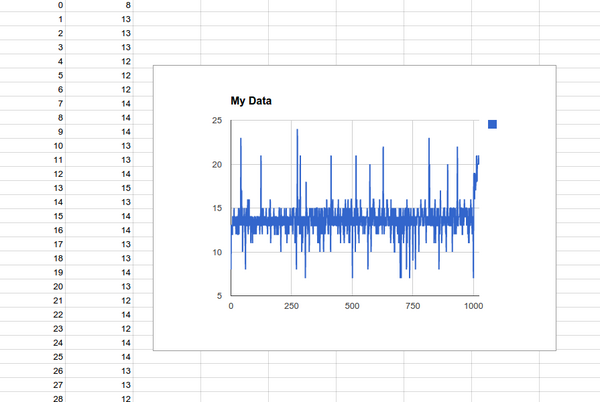
Open Google Drive, create a spreadsheet, click on cell A1 and click 'Paste'. The data you'd copied should be pasted into the spreadsheet and selected. Click Insert then Chart.
In the Chart Editor make sure Use column A as labels is selected, and a histogram of your data should be displayed. If you want a line graph we'd suggest clicking Charts and then Line. Click Insert and you now have a line graph of the data that you've collected!
Notes
Here, we're not using an SD card but are storing the data in a Int16Array (which is an efficient way to store data). That will store integer values between -32768 and 32767, so in order to get fractional temperature values we multiply the temperature by 100. You could use Float32Array so that you don't have to do this, but then you'd only be able to store half as much data (you can store many more than 1000 data items if you want to).
Source Code
var seconds = 240;

// store 100 history items
var history = new Int16Array(1000);

// A function to store the data in the history
function log() {
  // move all history values back by one
  history.set(new Int16Array(history.buffer,2));
  // set the last history value to the current temperature *100
  history[history.length-1] = E.getTemperature()*100;
}

// Do the logging every so often
setInterval(log, seconds*1000);
// Flash LED2 when the board is 'awake', so we can see if it is working
setSleepIndicator(LED2);
// Enable 'deep sleep' - this allows Espruino to enter ultra-low power modes
setDeepSleep(1);

// This is a utility function that will output our data
// in a form that can just be copy/pasted into a spreadsheet
function output() {
  history.forEach(function(v,i) {
    console.log(i+"\t"+(v/100));
  });
}
This page is auto-generated from GitHub. If you see any mistakes or have suggestions, please let us know.