Battery Monitor
Sometimes it might be useful to monitor a battery's voltage or current usage over time. Here we're using an Espruino board and a few passive components to monitor voltage and current, log them, and display them as a graph on the PC.
You'll need
- An MDBT42Q breakout, but any Bluetooth Espruino board will do (although Puck.js would need to be self-powered as it has no voltage regulator)
- 1x 1 Ohm high current (1W or more) resistor
- 2x 100 kOhm Resistors
- 1x 24 kOhm Resistor
- 2x Capacitors (0.1uF used here, almost anything will do)
Wiring
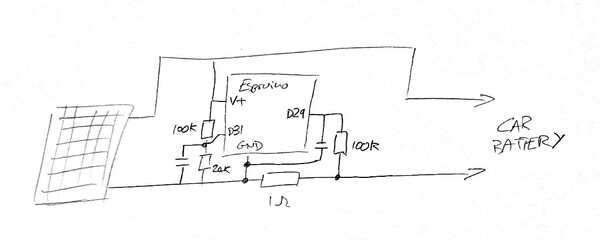
Connect as in the circuit above. We're using:
- D31 for voltage input
- D29 for current input
But any analog-capable inputs will do.
Software
We're using the Averager Library here to store data in a format that is easy to graph:
var Averager = require("Averager").Averager;
var volts, amps;
var voltAvr = new Averager({scale:1000});
var ampAvr = new Averager({scale:1000});

function onSecond() {
  amps = analogRead(D29)*3.3;
  volts = analogRead(D31)*3.3*(100+24)/24 - amps;

  voltAvr.add(volts);
  ampAvr.add(amps);

  var data = {
    v:Math.round(volts*100)/100,
    a:Math.round(amps*100)/100
  };
  NRF.setAdvertising({},{
    name:"\xF0\x9F\x9A\x98", // car emoji, see https://www.espruino.com/BLE+Emoji
    manufacturer:0x0590,
    manufacturerData:JSON.stringify(data)
  });
}
setInterval(onSecond, 1000);
NRF.setTxPower(4);
It's easy to extend this with the BTHome Library to allow your
battery level to appear in Home Assistant. We've kept the Averager in
so the webpage below will still work, but it's easy to remove:
var Averager = require("Averager").Averager;
var volts, amps;
var voltSum=0, ampSum=0, sumCount=0; // average for BTHome
var voltAvr = new Averager({scale:1000});
var ampAvr = new Averager({scale:1000});

const BAT_MIN = 11.63, BAT_MAX= 12.64;

function updateAdvertising() {
  // work out values based on average over last minute
  if (sumCount==0) sumCount=1;
  var volts = voltSum / sumCount;
  var amps = ampSum / sumCount;
  voltSum=0;
  ampSum=0;
  sumCount=0;
  // set advertising
  NRF.setAdvertising(require("BTHome").getAdvertisement([
    {
      type : "battery",
      v : E.clip(100*(volts-BAT_MIN)/(BAT_MAX-BAT_MIN),0,100)
    },
    {
      type : "temperature",
      v : E.getTemperature()
    },
    {
      type : "voltage",
      v : volts
    },
    {
      type : "current",
      v : amps
    },
  ]), {
    name:"\xF0\x9F\x9A\x98", // car emoji, https://www.espruino.com/BLE+Emoji
    manufacturer : false, ///< turn off manufacturer data advertising (enabled by default in 2v26, interferes with BTHome)
    // not being connectable/scannable saves power (but you'll need to reboot to connect again with the IDE!)
    //connectable : false, scannable : false,
  });
}

function onSecond() {
  amps = analogRead(D29)*3.3;
  volts = analogRead(D31)*3.3*(100+24)/24 - amps;

  voltAvr.add(volts);
  ampAvr.add(amps);

  voltSum += volts;
  ampSum += amps;
  sumCount++;

  var data = {
    v:Math.round(volts*100)/100,
    a:Math.round(amps*100)/100
  };
}
setInterval(onSecond, 1000);
setInterval(updateAdvertising, 60000); // only update advertising once a minute
updateAdvertising();

NRF.setTxPower(4);
Webpage
You'll need to serve this off a HTTPS link - see the Web Bluetooth page for more information.
Note: you can try this out as-is just by clicking the Try Me! link.
<html>
  <head>
  </head>
  <body>
    <div id="data"></div>

    <script src="https://www.puck-js.com/puck.js"></script>
    <script src="https://cdn.jsdelivr.net/npm/chart.js@2.9.4/dist/Chart.min.js"></script>
    <script>
var dataElement = document.getElementById("data");
var voltData, ampData;
var csvData = "";

function addChart(id, voltData, ampData, title) {
  var labels = voltData.current.map((y,x)=>x);
  if (id == "hrChart") labels = voltData.current.map((y,x)=>`${x>>2}:${((x&3)*15).toString().padStart(2,0)}`);
  if (id == "moChart") labels = "Jan,Feb,Mar,Apr,May,Jun,Jul,Aug,Sept,Oct,Nov,Dec".split(",");
  new Chart(document.getElementById(id), {
      type: 'line',
      data: {
        labels : labels,
        datasets : [
          {  data: voltData.current, label: 'Volts', borderColor: "red",
              backgroundColor: 'rgba(0, 0, 0, 0)', fill: false, },
          {  data: voltData.last, label: 'Last Volts', borderColor: "darkred",
              backgroundColor: 'rgba(0, 0, 0, 0)', fill: false, },
          {  data: voltData.avr, label: 'Average Volts', borderColor: "grey",
              backgroundColor: 'rgba(0, 0, 0, 0)', fill: false, },

          {  data: ampData.current.map(x=>x*10), label: 'Amps x10', borderColor: "green",
              backgroundColor: 'rgba(0, 0, 0, 0)', fill: false, },
          {  data: ampData.last.map(x=>x*10), label: 'Last Amps x10', borderColor: "darkgreen",
              backgroundColor: 'rgba(0, 0, 0, 0)', fill: false, },
          {  data: ampData.avr.map(x=>x*10), label: 'Average Amps x10', borderColor: "grey",
              backgroundColor: 'rgba(0, 0, 0, 0)', fill: false, },
        ]
      },
      options: {
                responsive: true,
                title: {
                    display: true,
                    text: title
                },
                tooltips: {
                    mode: 'index'
                }
      }
    });
}

function getData() {
  // get the data
  dataElement.innerHTML = '<span style="font-size:300%;position:absolute;top:50%;left:50%;transform:translate(-50%,-50%)">Loading...</span>';
  Puck.write(`\x10voltAvr.print()\n`,data=>{
    // if we have a JS prompt at the end of what's printed, remove it
    if (data.endsWith(">"))
      data = data.slice(0,-1);
    voltData = JSON.parse(data);
    Puck.write(`\x10ampAvr.print()\n`,data=>{
      // if we have a JS prompt at the end of what's printed, remove it
      if (data.endsWith(">"))
        data = data.slice(0,-1);
      ampData = JSON.parse(data);

      // Draw graphs
      dataElement.innerHTML = `
        <div><canvas id="hrChart"></div>
        <div><canvas id="dayChart"></div>
        <div><canvas id="moChart"></div>`;
      addChart('hrChart', voltData.hours, ampData.hours, "Hourly");
      addChart('dayChart', voltData.days, ampData.days, "Daily");
      addChart('moChart', voltData.months, ampData.months, "Monthly");
    });
  });
}

Puck.modal(function() {
  getData();
});
    </script>
  </body>
</html>
This page is auto-generated from GitHub. If you see any mistakes or have suggestions, please let us know.